

Plackett-Burman Experimental Design: When and How to Use It in Your DOE
Published: October 7, 2024 by Manikandan Jayakumar

© Oakland Images/Shutterstock.com
- The Plackett-Burman design method is one of the most useful tools when you don’t have all the data available for an experiment.
- They cannot show any correlation between data sets without a clearer picture.
- They are useful for screening or seeing where certain factors might influence the outcome of a process.
Plackett-Burman experimental design is used to identify the most important factors early in the experimentation phase when complete knowledge about the system is usually unavailable.
Developed in 1946 by statisticians Robin L. Plackett and J.P. Burman, it is an efficient screening method to identify the active factors using as few experimental runs as possible.
In Plackett-Burman designs, the main effects have a complicated confounding relationship with two-factor interactions. As such, these designs should be used to study the main effects when it can be assumed that two-way interactions are negligible.
In practical use, two-level full or fractional factorial designs, and Plackett-Burman designs are often used to screen for the important factors that influence process output measures or product quality.
However, these designs are useful for fitting first-order models (which detect linear effects). Accordingly, they can provide information on the existence of second-order effects (curvature) when the design includes center points.
Full Factorial Experiment
To demonstrate the effectiveness of the Plackett-Burman design, an experiment was conducted to compare a full factorial experiment with a Plackett-Burman design. Let’s start with the full factorial experiment, which consists of five factors with two levels for each factor.
With this in mind, the total number of experiments is 2 5 = 32 (Table 1). The characteristic of the response, Y , is the larger the better.
Normal Plot
The primary goal of screening designs is to identify the vital few factors or key variables that influence the response. A normal plot is one of the graphs that help identify these influential factors.
Accordingly, in the normal probability plot of the effects, points that do not fall near the line have measured values that are significantly beyond the observed variation, and usually signal important effects. Important effects are larger and generally further from the fitted line than unimportant effects. Unimportant effects tend to be smaller and centered around zero.
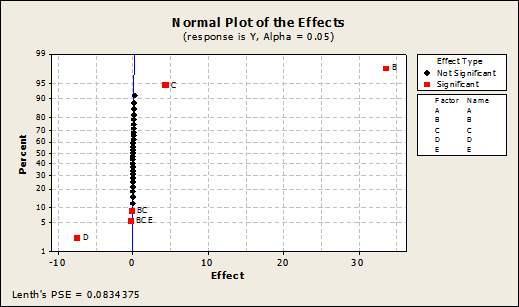
As shown in the normal plot (Figure 2) and the analysis of variance (ANOVA, Figure 3), the factors B, C, and D are significant to the response. Additionally, there are two-way interactions between factors B and C and three-way interactions among B, C, and E.
Main Effects Plot
In experimental design, a main effects plot is used in conjunction with ANOVA to examine differences among level means for one or more factors. It graphs the response mean for each factor level connected by a line. As can be seen, a main effect is present when different levels of a factor affect the response differently (shown as a slope on a two-level plot).
Some general patterns to look for with main effects plots include the following:
- When the line is horizontal (parallel to the x-axis), then there is no main effect present. Each level of the factor affects the response in the same way, and the response mean is the same across all factor levels.
- When the line is not horizontal, then a significant main effect may be present. Different levels of the factor affect the response differently. The greater the slope, the greater the likelihood that a main effect is statistically significant.
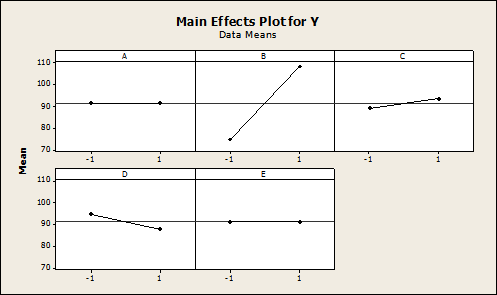
The factors B, C, and D are shown to be significant to the response Y as shown in Figure 3.
Response Optimization
The Response Optimizer function in Minitab helps to identify the combination of input variable settings that jointly optimize a single response or a set of responses. (Note: Minitab requires the user create a starting point for the optimization and will find the first best solution based on the requested optimization objective.) This function provides an optimal solution for the input variable combinations and an optimization plot. The optimization plot is interactive – input variable settings on the plot can be adjusted to search for more desirable solutions.
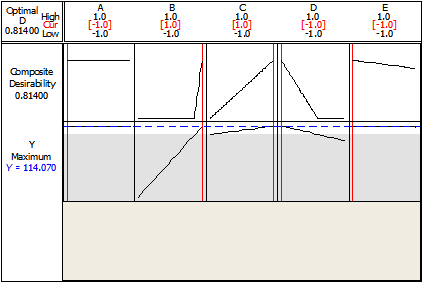
The nature of the response, Y , is “the larger the better” – and the maximum value that can be achieved in this experiment is 114.07, as shown in Figure 4.
That means to achieve the maximum value of Y , the process variables should be set as shown in Table 2.
Plackett-Burman Experiment
Having completed the two-level full factorial experiment, let’s turn to the Plackett-Burman experiment for comparison. In this experiment, five factors with two levels are considered. The total number of experiments is selected to be the minimum from the Plackett-Burman design – 12 experiments (Table 3). Remember that for Y , the larger the better.
Breaking Down the Plackett-Burman Design
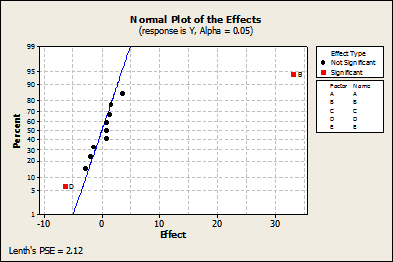
As shown in the normal plot in Figure 5, factors B and D are significant. As shown in Figure 6 with ANOVA, factors B, C, and D are significant to the response Y. It is important to note that the significance of interactions is not displayed as Plackett-Burman’s design is interested only in the main effects.
The main effects plot (Figure 7) shows that the factors B, C, and D are significant to the response Y .
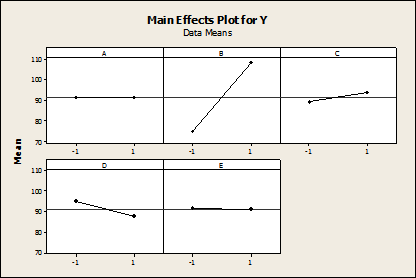
The nature of the response, Y , is the larger the better, and the maximum value that can be achieved in this experiment, according to the Response Optimizer (Figure 8), is 116.46.
Thus, to achieve the maximum value of Y , the process variables should be set as shown in Table 4.
Why It Matters
Hypothesis testing is a crucial part of any project. However, you might not have all the data available for an expected result right off the bat. As such, the Plackett-Burman allows you to readily run a test to see if there are significant influences that might sway the outcome of a given process.
Comparison of the DOE Results
A comparison of the results obtained from both the full factorial design of experiments and the Plackett-Burnam design of experiments is shown in Table 5.
There is no difference in significant factors or significant levels, but there is a slight difference in the optimized value of Y . The factor settings and conclusion remain the same when using either design, but there is a significant difference in the number of experiments that need to be conducted to achieve these results.
When to Use Plackett-Burman Design
It is particularly helpful to use the Plackett-Burman design:
- In screening
- When neglecting higher-order interactions is possible
- In two-level multi-factor experiments
- When there are more than four factors (if there are between two to four variables, a full factorial can be performed)
- To economically detect large main effects
- For N = 12, 20, 24, 28 and 36 (where N = the number of experiments)
Drawbacks of Plackett-Burman Design
There are also some drawbacks to using Plackett-Burman designs that practitioners should be aware of:
- They do not verify if the effect of one factor depends on another factor.
- If you run the smallest design you can, it does not follow that enough data has been collected to know what those effects are precisely.
Other Useful Tools and Concepts
There are plenty of useful tools at the ready when going through your DOE process. I heavily recommend looking into the details behind the full factorial design . While we touch on it briefly here, it isn’t an exhaustive or comprehensive look at the subject.
Additionally, you might want to see how DOE impacts any given process. Kienle + Spiess has utilized Lean Six Sigma DOE to transform the quality of its welds. You can see how they’ve done it in our informative post-mortem taking a look at the steps they took.
Plackett-Burman design is helpful if complete knowledge about the system is unavailable or in the case of screening with a higher number of factors. However, once the significant factors are available and the interactions between the factors are required, it is better to go with full factorial design as it takes the combinations of all the levels between the factors and provides the interaction details.
The image featured at the top of this post is ©Oakland Images/Shutterstock.com.
Join 65,000 Black Belts and Register For The Industry Leading ISIXSIGMA Newsletter Today
About the author.
Manikandan Jayakumar
Lean Six Sigma Training Certification
- Facebook Instagram Twitter LinkedIn YouTube
- (877) 497-4462

Design of Experiments: Plackett–Burman designs
May 15th, 2024
Many scientific trials involve various influences potentially shaping results. Screening tactics like Plackett-Burman designs optimize probing them when budgets and hours prove limited.
Plackett-Burman emerged through statisticians’ work in the ‘40s as a proficient, economical technique within the Design of Experiments (DoE) pinpointing prime movers.
It lets researchers expeditiously gauge numerous determinants utilizing comparatively slight repeats. Particularly helpful amid abundance awaiting assessment, its end flags the foremost few necessitating investigation.
By this first-pass filtering, concentration shifts optimally. The main effects dominating interactions chiefly at screening stages underlie Plackett-Burman’s presumptions.
None optimize alone amid evolving imperatives – our joined comprehension elevates every pursuit. By cooperative modernizations amid unforeseen complexities ahead, all champion prosperity upholding benefit for all. Progress indeed follows shared betterment paths as one.
Key Highlights
- Plackett-Burman screening’s deftness lies in pinpointing primaries through quicker, thriftier trials. Its efficiency uncovers the most influential factors among many through compressed tests.
- Pinpointing the impactful few remains its aim where abundance potentially influences results. Calculated impartiality against interference lets main impacts isolation without other element convolutions.
- Plackett-Burman main effect derivation and vitals branding employ stat examinations. While unable to estimate interplays and assuming three-variable interaction insignificance, first-pass filtration upgrades remain its mastery.
- None optimize alone amid evolving needs – united comprehension elevates proficiency. Their criteria and restraints acknowledged such designs prove helpful harbinger works.
- Future betterments unlock through cooperation, as impediments ahead surface jointly surmounted. Progress pursues cooperation paths, serving people’s latest demands through persistently improving means collaboratively.
What is Plackett-Burman Designs?
Plackett-Burman trials present a screening approach within the Design of Experiments (DoE). Their economic examination of factors up to k=N-1 among N repeats (when evenly divisible by four) renders them popular.
Screenings including Plackett-Burman seek the strong few from many likely influencers. They efficiently explore an abundance through limited repeats, pinpointing primaries deserving focused optimization.
Developed by statisticians Robin Plackett and J.P. Burman in ’46, these designs reliably and affordably gauge the extent of variables. Especially valuable with numerous potentials and limited budgets, their resolution ensures distinct main effects.
Common applications involve:
- Key manufacturing parameters
- Formulation’s critical components
- Top quality determinants
- Foremost chemical reactions
- Important biological drivers
Acknowledging restraints, these screenings prove helpful starting points. Future refinement unlocks through cooperation; none improves alone amid evolving needs. Together, understanding lifts enterprises to serve people continually.
Plackett-Burman Design Basics
The Plackett-Burman design is a type of two-level fractional factorial design used in screening experiments. It allows you to study up to N-1 factors in N experimental runs, where N is a multiple of 4. The design is very economical and efficient for screening a large number of factors to identify which ones have significant main effects.
The key characteristics of a Plackett-Burman design include:
- Two-Level Factors: Each factor is tested at two levels, a high (+1) and low (-1) setting. This allows you to estimate the main effects but not the interaction effects.
- Resolution III Design: It is a resolution III fractional factorial design. This means main effects are not confounded or aliased with any other main effect, but they are aliased with two-factor interactions.
- Foldover Pairs: The design matrix is constructed from the first N runs and then “folded over” to get the remaining N runs by reversing the signs. This creates foldover pairs of runs.
- Design Generators: The design generators determine how the runs are aligned with the two-factor interactions. Proper selection of generators is important.
The design matrix of a Plackett-Burman experiment has N rows (runs) and N-1 columns representing the factors being screened. The entries are simply +1 and -1, indicating the high and low levels for each factor and run combination.
While economical, Plackett-Burman designs do have limitations in that they cannot estimate interaction effects and can only screen several factors equal to one less than a multiple of 4. However, they are very useful for initial factor screening when many factors are involved.
Creating a Plackett-Burman Design
The Plackett-Burman design allows you to efficiently study up to k=N-1 factors in N experiment runs, where N is a multiple of 4. This makes it a very economical screening design when you have a large number of potential factors to investigate.
To create a Plackett-Burman design, you first need to determine the appropriate design size N based on the number of factors k you want to estimate the main effects for. Common design sizes are N=8 runs for 7 factors, N=12 runs for 11 factors, and N=20 runs for 19 factors.
Once you have selected the design size N, the design matrix can be generated using what are known as “design generators”. These are specific mathematical algorithms that create the +1 and -1 factor level combinations for each run optimally. The design generators ensure that the design is balanced so that all main effects are uncorrelated and can be estimated independently.
The design matrix will have N runs as the rows, and k+1 columns. The first column is a dummy column of +1s, and the remaining k columns correspond to the k factors being screened. Each column will have an equal number of +1 and -1 entries.
It’s important to properly randomize and replicate the Plackett-Burman design runs to ensure valid conclusions. Randomization protects against any systematic biases, while replication allows you to obtain an estimate of pure experimental error.
In addition to the design generators, there are tables and software that can quickly generate the design matrix for common Plackett-Burman designs. Minitab , JMP, and other DOE software packages have built-in utilities for creating these designs.
Analyzing Plackett-Burman Experiments
Once you have conducted your Plackett-Burman screening experiment, the next step is to analyze the results to determine which factors are potentially important.
The analysis involves calculating the main effects and making judgments about which effects are large enough to be considered active and worthy of further investigation.

Main Effects
The primary analysis for a Plackett-Burman design calculates the main effects, which estimate the impact of each factor averaged across all levels of the other factors.
Main effects are calculated by contrasting the response averages when a factor is at its high and low levels. Larger main effect values indicate factors that are more influential on the response.
Statistical Significance Testing
To judge whether a main effect is large enough to be considered active and worthy of further study, statistical significance testing is used.
The null hypothesis is that the main effect equals zero (the factor has no effect). Effects larger than a critical value are considered statistically significant evidence that the factor is active and impacting the response. The critical value depends on the significance level, number of effects tested, and error degrees of freedom.
Effect Magnitude and Ranking
In addition to statistical significance, the practical magnitude of effects is also considered when identifying active factors.
Effects are typically ranked from largest to smallest in absolute value. The largest effects, regardless of statistical significance, are considered potentially important for further evaluation.
Interaction Effects
Though less common, it is also possible to estimate two-factor interaction effects with a Plackett-Burman design.
However, this requires higher resolution designs that avoid confounding interactions with main effects. Significant interactions indicate that the impact of one factor depends on the level of another factor.
Normal Probability Plots
Normal probability plots of the effects are a useful diagnostic tool. Active effects will be scattered away from the normal line, while inactive effects cluster along the line. This visual analysis can supplement or replace formal statistical tests.
Plackett-Burman designs provide an efficient way to screen many factors simultaneously to identify the few active factors. Proper analysis of the main effects is crucial to take full advantage of this experimental strategy. The identified active factors can then be further explored and optimized through additional experiments.
Plackett-Burman Design Examples
To better understand how Plackett-Burman designs work, let’s walk through a couple of examples.
Example 1: Screening 7 Factors in 8 Runs
Suppose an engineer wants to study the effects of 7 different factors (A, B, C, D, E, F, G) on a particular process output or response.
Using a Plackett-Burman design, this can be accomplished in just 8 experimental runs rather than the 128 runs required for a full 2^7 factorial design.
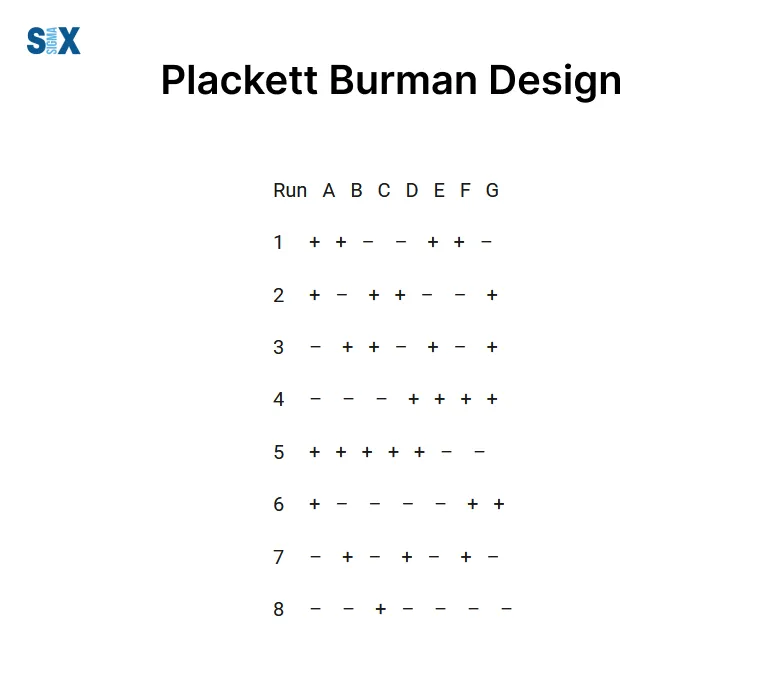
The design matrix for this 8-run Plackett-Burman design is:
Run A B C D E F G
1 + + – – + + –
2 + – + + – – +
3 – + + – + – +
4 – – – + + + +
5 + + + + + – –
6 + – – – – + +
7 – + – + – + –
8 – – + – – – –
The design is constructed such that each factor is tested at two levels (+/-) across the 8 runs. The plus and minus signs represent the high (+) and low (-) settings for each factor.
By running these 8 experiments and analyzing the results, the engineer can identify which of the 7 factors have a statistically significant effect on the response. The factors found insignificant can be dropped, allowing further experimentation to focus only on the vital few factors.
Example 2: Plackett-Burman for Process Optimization
A food scientist is studying how 11 ingredient and process variables (A-K) impact the taste and texture of a baked good product. To screen all 11 factors using a Plackett-Burman design, a 12-run design is selected.
The design matrix looks like this:
Run A B C D E F G H I J K
1 + + + – – – – + + + +
2 – + + + – – – – + + +
… (10 more runs not shown)
The plus and minus signs represent the high and low settings for each factor tested over the 12 experimental runs.
Analysis of the results identifies factors B, D, G, and J as having a significant impact on the product’s sensory characteristics. Further optimization experiments can then focus just on these 4 key factors.
These examples illustrate how Plackett-Burman screening designs enable efficient testing of many factors in relatively few runs. They allow the vital few factors to be identified from a larger set of potential factors.
Plackett-Burman vs Other DOE Methods
The Plackett-Burman design is just one type of experimental design used in DOE ( design of experiments ). It’s important to understand how it compares to some other popular DOE techniques:
Plackett-Burman vs Full Factorial
A full factorial design looks at all possible combinations of factor levels. This allows estimation of all main effects and interactions but requires a large number of runs, especially as the number of factors increases. The Plackett-Burman is a fraction of the full factorial that focuses only on the main effects of reducing the number of required runs.
Plackett-Burman vs Fractional Factorial
Like the Plackett-Burman, fractional factorial designs are a fraction of the full factorial experiment.
However, fractional factorials can estimate the main effects and some interactions, while the Plackett-Burman estimates only the main effects. Fractional factorials require more runs than Plackett-Burman for the same number of factors.
Plackett-Burman vs Response Surface Methods
Response surface methods like central composite and Box-Behnken designs are used when the objective is to optimize a response by mapping it over the factor ranges. The Plackett-Burman is mainly used for screening to identify the critical factors before optimization.
Plackett-Burman vs Taguchi Methods
Taguchi methods like the L8, L9, etc. orthogonal arrays are also used for screening and optimizing quality characteristics. Compared to Plackett-Burman, Taguchi designs look at interactions in addition to main effects but require more runs for the same number of factors.
The Plackett-Burman design is an economical screening design well-suited for studying main effects when resources are limited. It complements other DOE methods focused on interactions, optimizing responses, or quality improvement.
Limitations and Assumptions
While Plackett-Burman designs are efficient screening designs, there are some important limitations and assumptions to be aware of:
Assumptions
- The design assumes that there are no active interactions between factors. If interactions do exist, the main effects will be aliased or combined with the interaction effects, making them difficult to interpret.
- It assumes that all main effects are of the same magnitude and follow approximately a normal distribution. Highly skewed or non-normal data can violate this assumption.
- The design assumes that the factors are measured quantitatively and can be set at two levels (high and low).
Limitations
- Plackett-Burman cannot estimate interaction effects. It can only identify the few vital main effects from many potential factors.
- The design has limited flexibility in run sizes. The number of experimental runs is a multiple of 4 rather than the ideal multiple of 2.
- The design has a resolution of III, meaning that the main effects are aliased or combined with two-factor interactions. This confounding pattern limits the ability to study interactions.
- As the number of factors increases, the number of runs required increases rapidly, which can become impractical when studying many factors.
- The design is directional, meaning flipping the high and low levels changes the sign of the estimated effects.
- Plackett-Burman cannot be used for quantitative factor settings or to fit a response surface model.
To address these limitations, fractional factorial or response surface designs may be more appropriate if the objective is to estimate interactions, fit a quadratic model, or study a large number of factors economically.
However, for the screening of many factors to identify the vital few, Plackett-Burman designs provide an efficient way to gather useful information with a relatively small number of runs.
SixSigma.us offers both Live Virtual classes as well as Online Self-Paced training. Most option includes access to the same great Master Black Belt instructors that teach our World Class in-person sessions. Sign-up today!
Virtual Classroom Training Programs Self-Paced Online Training Programs
SixSigma.us Accreditation & Affiliations

Monthly Management Tips
- Be the first one to receive the latest updates and information from 6Sigma
- Get curated resources from industry-experts
- Gain an edge with complete guides and other exclusive materials
- Become a part of one of the largest Six Sigma community
- Unlock your path to become a Six Sigma professional
" * " indicates required fields
Analytical Methods
Experimental design and optimisation (4): plackett–burman designs.
Good experimental design is important in many studies of analytical and other chemical processes. Complete factorial designs, which study all the factors (experimental variables) affecting the system response, using at least two levels (values) for each factor, can give rise to an unacceptably large number of trial experiments. This is because even apparently simple processes may be affected by a large number of factors. Moreover these factors may affect the system response interactively, i.e. the effect of one factor may depend on the levels of others. Any interactions must also be distinguished from random measurement errors. So it is more common to use partial factorial designs in which some information, especially about interactions, may be sacrificed in the interests of a manageable number of experiments.

- This article is part of the themed collection: Analytical Methods Committee Technical Briefs
Article information
Download citation, permissions.
Analytical Methods Committee, AMCTB No 55, Anal. Methods , 2013, 5 , 1901 DOI: 10.1039/C3AY90020G
To request permission to reproduce material from this article, please go to the Copyright Clearance Center request page .
If you are an author contributing to an RSC publication, you do not need to request permission provided correct acknowledgement is given.
If you are the author of this article, you do not need to request permission to reproduce figures and diagrams provided correct acknowledgement is given. If you want to reproduce the whole article in a third-party publication (excluding your thesis/dissertation for which permission is not required) please go to the Copyright Clearance Center request page .
Read more about how to correctly acknowledge RSC content .
Social activity
Search articles by author, advertisements.

IMAGES
COMMENTS
Plackett–Burman designs are experimental designs presented in 1946 by Robin L. Plackett and J. P. Burman while working in the British Ministry of Supply. [1] Their goal was to find experimental designs for investigating the dependence of some measured quantity on a number of independent variables (factors), each taking L levels, in such a way as to minimize the variance of the estimates of ...
Oct 7, 2024 · Plackett-Burman experimental design is used to identify the most important factors early in the experimentation phase when complete knowledge about the system is usually unavailable. Developed in 1946 by statisticians Robin L. Plackett and J.P. Burman, it is an efficient screening method to identify the active factors using as few experimental ...
Oct 10, 2008 · A Plackett−Burman design of 12 runs was applied to simultaneously screen the variables that significantly affect the analytical response. 38, 39 For this study, the selected extraction variables ...
Plackett–Burman in action PB designs have been used in an enormous variety of chemical and biochemical studies, synthetic as well as analytical. Spec-troscopy, electrochemistry and chromatography have all proved to be fertile elds for their application in measurement science. In practice, designs with 12 and 20 runs seem to have been most ...
A Plackett-Burman Design can help you sort out which factors to concentrate on, greatly reducing the amount of data you have to collect. For example, if you have 15 factors in your design, you can work with as few as 20 data points in a Plackett-Burman. A full factorial design would require over a thousand times that amount (32,768 data points).
Plackett-Burman designs are very efficient screening designs when only main effects are of interest. These designs have run numbers that are a multiple of 4 Plackett-Burman (PB) designs are used for screening experiments because, in a PB design, main effects are, in general, heavily confounded with two-factor interactions.
May 15, 2024 · Plackett-Burman Design Basics. The Plackett-Burman design is a type of two-level fractional factorial design used in screening experiments. It allows you to study up to N-1 factors in N experimental runs, where N is a multiple of 4.
Plackett–Burman design detect the main effects of robustness changes. {A 12 experiment P-B layout is ideal for 7 to 8 factors as can include dummy factors {A 12 experiment P-B layout is feasible to run in one day {Total number of extractions is about 28-30
Plackett–Burman fundamentals A popular and economical approach that gives information only on the effects of single factors, but not on interactions, is the Plackett–Burman (PB) method, introduced in 1946 when the authors were working for the British Ministry of Supply.
Good experimental design is important in many studies of analytical and other chemical processes. Complete factorial designs, which study all the factors (experimental variables) affecting the system response, using at least two levels (values) for each factor, can give rise to an unacceptably large number o